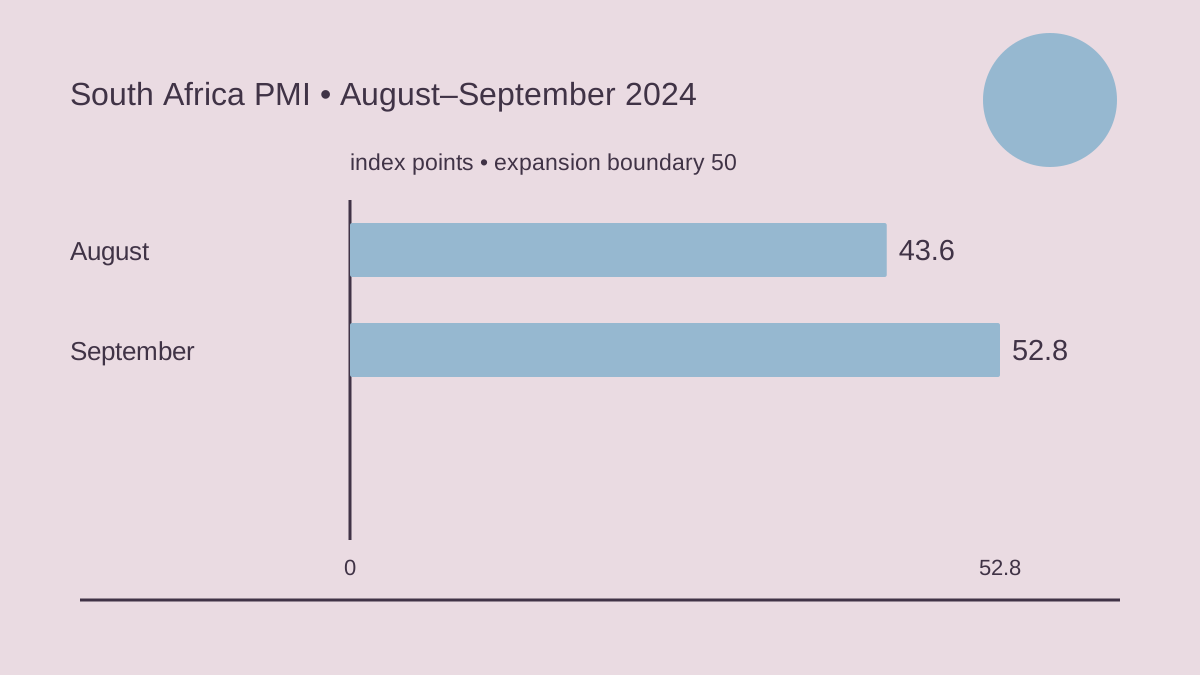
South Africa’s manufacturing survey returned to expansion in September 2024. Reuters reported on October 1 that the seasonally adjusted Absa Purchasing Managers’ Index rose to 52.8 from August’s 43.6. The 9.2-point increase reversed the preceding month’s 8.8-point fall. Absa reported improving domestic and export demand and said the recent interest-rate cut supported expectations for stronger consumer demand. It nevertheless identified employment as a continuing challenge for manufacturers.
An uneven start to the year
The year had opened with a much weaker reading. In its February 2 republication of Reuters’ January report, Bizcommunity put the seasonally adjusted manufacturing PMI at 43.6, down from 50.9 in December. That moved the headline indicator well below the 50-point boundary separating expansion from contraction. A steep fall in new sales orders, the survey’s measure of demand, contributed to the decline. Absa described an unusually poor start: outside the global financial crisis of 2008–09 and the pandemic lockdowns of 2020, readings that low had occurred only a handful of times.
February’s headline recovery did not mean every component had recovered. Engineering News reported on March 1 that the PMI reached 51.7, but only the supplier-performance component exceeded 50. Business activity stood at 48.6 and new orders at 49.9. The employment indicator remained below 50 for a fourteenth consecutive month. Inventories recovered to 48.9, while expected conditions six months ahead improved to 59.5 from January’s 58.7. Purchasing prices reached 72.2. Absa warned that sustained increases in that cost indicator could pose an upside risk to factory-gate inflation rather than establish a completed recovery in output.
In March, the headline fell back to 49.2. The April 2 report placed business activity at 44.5, new orders at 45.5 and inventories at 47.6. Supplier deliveries fell to 54.1 from 62: this component is inverted, so a lower reading indicates faster deliveries. Absa considered improving supply chains a more likely explanation than weakening demand alone. Employment rose to 54.4 and expected conditions reached 62.1, even as purchasing prices increased to 74.6. The survey therefore combined weaker current activity and orders with more optimistic expectations and a higher reading for input-price pressure.
Power relief and renewed volatility
April brought another move into expansion. Reuters reported on May 2 that the manufacturing PMI rose to 54.0 from March’s 49.2. Absa associated the improvement in business activity with a month without rolling power cuts. That operational relief did not remove the demand problem: respondents still described demand as sluggish, and export orders were less strong than domestic orders. The report also referred to Eskom’s winter outlook for limiting power cuts. That was an expectation about the coming season, while the absence of power cuts in April described conditions already experienced during the survey month.
The May survey reversed that improvement despite another month without load-shedding. The June 3 report put the headline at 43.8, activity at 38.1 and new orders at 37.8. Respondents said customers had postponed orders until the elections and their outcome; Absa attributed the deterioration mainly to demand. Employment fell to 43.5 and inventories to 44.5. European component-delivery problems also affected transport manufacturers. Purchasing prices eased to 66.9 from 72.4, while expected conditions improved to 57.6. Lower cost pressure and better expectations therefore coexisted with weaker orders, activity and employment in the same survey.
June remained below the expansion boundary, although the headline improved to 45.7 from May’s 43.8. Reuters’ July 1 report again identified weak demand. Absa suggested uncertainty about the emerging coalition government might have contributed, but presented that connection as an explanation rather than a measured change in production. The political setting was still developing: a 32-member cabinet had been announced on the preceding Sunday. For manufacturers, the survey’s immediate result was a second consecutive month below 50, with some improvement from May’s level rather than a return to the expansion readings recorded earlier in the year.
July then produced a stronger reading of 52.4, compared with 45.7 in June. In the Reuters report published on August 1, both domestic and global demand had improved, and the activity and new-orders components had risen. Absa contrasted this with May and June, when it said significant policy uncertainty had hurt demand following the national election. The bank interpreted July’s improvement as previously deferred orders being realised and translated into activity. That explanation linked the survey’s current improvement to orders placed on hold earlier; it did not establish that the stronger reading would persist through subsequent months.
August interrupted that rebound. The September 2 report recorded a headline of 43.6, activity of 38.9 and new orders of 34.6. Respondents cited weaker domestic sales and orders; export sales also contracted. Employment remained in contraction for a second month, while supplier performance improved by 4.5 points. Expectations six months ahead fell to 61.3 from July’s 69.4 but remained relatively high. Those figures explain the starting point for September’s recovery: a sharp deterioration in current demand and activity had occurred alongside an expectation of better conditions later, rather than a uniformly negative set of survey responses.
The measured production path
Official output statistics provide a separate view of factory performance. Statistics South Africa’s April 11 release initially put February production 4.1% above a year earlier, while seasonally adjusted output fell 0.3% from January. Production over December–February was unchanged from the preceding three months. Wood, paper and printing rose 14.9% year on year, contributing 1.5 percentage points to the overall increase. Food and beverages added 1.3 points, and petroleum, chemicals, rubber and plastics added one point. Annual growth therefore accompanied a small monthly decline and a flat three-month comparison in that release.
The May 9 release showed a pronounced March reversal: manufacturing output fell 6.4% year on year and 2.2% from February after seasonal adjustment. Transport equipment declined 25.9% annually, subtracting 2.7 percentage points from total growth; metals and machinery fell 9.0%, subtracting 1.9 points. First-quarter production was 1.0% below the previous quarter, with five of ten divisions declining. Transport equipment and metals were the largest quarterly drags, while food and beverages and chemicals made positive contributions. These were production-volume estimates published in May, rather than the separate national-accounts measure of manufacturing’s value added.
April’s initial output report, released on June 11, showed a 5.3% annual increase and a 5.2% seasonally adjusted monthly rise. Chemicals contributed 1.1 percentage points to annual growth; wood and paper, metals, and food each contributed 0.9 points. Yet production over the three months ending in April remained 0.5% below the preceding three months, with six divisions declining. Transport equipment fell 9.1% over that comparison and textiles fell 5.1%, while food rose 2.4%. Manufacturing sales at current prices increased 5.6% in April. The stronger single month had therefore not lifted the whole three-month production comparison into growth.
The July 11 publication initially estimated May’s annual production decline at 0.6%, alongside a 3.2% seasonally adjusted monthly fall. Metals and machinery were down 8.1% annually, contributing minus 1.8 percentage points; transport equipment fell 11.8%, contributing minus 1.2 points. Output over the three months ending in May declined 0.4%, with seven divisions recording falls. Food and beverages instead rose 2.0% over that comparison, adding half a percentage point. The release placed April’s monthly gain at 5.2%. These figures describe the July publication’s estimates; subsequent monthly releases revised earlier observations, including May’s monthly movement.
The August 8 report put June production 5.2% below a year earlier and 0.5% below May after seasonal adjustment. It revised May’s monthly decline to 3.6% and April’s increase to 5.5%. Across April–June, however, output rose 0.9% from the first quarter, with six divisions growing. Transport equipment, food and beverages, and metals made the largest positive quarterly contributions. June’s annual comparison remained weaker: metals declined 8.4%, transport equipment 15.6% and food 6.0%. A positive quarter and a negative final month thus appeared together in the same statistical release, covering different comparison periods.
Manufacturing in the national accounts
The national accounts showed manufacturing’s contribution to the wider economy. On June 4, Statistics South Africa initially reported that first-quarter GDP fell 0.1%, following revised growth of 0.3% in the final quarter of 2023. Manufacturing value added declined 1.4%, subtracting 0.2 percentage points from GDP growth, with automotive production the largest negative contributor within manufacturing. Exports fell 2.3%, and gross fixed capital formation declined 1.8% for a third consecutive quarter. The economy also recorded a R5.5 billion inventory drawdown. This June assessment preceded the revision to first-quarter GDP published with the September national accounts.
The September 3 release revised first-quarter GDP growth to zero and put second-quarter growth at 0.4%. Manufacturing value added rose 1.1%, contributing 0.1 percentage point, with six manufacturing divisions expanding. Electricity, gas and water grew 3.1%, while transport, storage and communication fell 2.2%. Household consumption increased 1.4%, but fixed investment declined another 1.4%, including a 1.2% fall in machinery and equipment. Inventories increased by an annualised R9.6 billion. Thus the national accounts recorded a manufacturing rebound alongside weaker investment, using value added rather than the monthly survey’s measure of physical production volume.
Confidence, sales and investment intentions
The Absa manufacturing survey, published by the Bureau for Economic Research on June 12, showed confidence rising to 28 from 21 in the first quarter, below its long-term average of 36. Food-sector confidence reached 34 and metals reached 33, while transport fell to nine. The survey was conducted before the May 29 election. A net 14% of respondents reported declining domestic sales volumes, compared with a net 1% reporting lower export sales. Employment and hours worked declined. Improving confidence therefore appeared alongside subdued domestic demand and weaker employment, even though subsectors reported stronger export performance.
The September 16 quarterly report kept manufacturing confidence at 28. Net balances showed more firms reporting declines than increases in domestic sales, exports and production, by 21%, 26% and 26% respectively. Employment weakened, but a net 5% reported higher fixed investment, mainly factory refurbishment rather than new plants. The report also summarised July’s official output increase of 1.7% annually and 2.1% monthly, with June revised to declines of 5.5% and 0.4%. Those later estimates differ from the August release. The quarterly survey preceded the rate cut and September PMI rebound; its expectations described that earlier information setting.
Factory-gate prices and changing weights
The producer-price series adds a price perspective to these volume and confidence measures. Statistics South Africa’s February 29 release put January inflation for final manufactured goods at 4.7%, up from December’s 4.0%, with prices rising 0.1% monthly. Food, beverages and tobacco contributed 1.2 percentage points to annual inflation, followed by metals and machinery at 0.8 points. The release introduced updated manufacturing baskets and weights based primarily on the 2021 large-sample manufacturing survey. All producer-price indices were rebased to December 2023 equals 100. Intermediate manufactured-goods prices rose 0.2% annually, a separate series from final goods.
By May, annual inflation for final manufactured goods stood at 4.6%, down from April’s 5.1%, according to the June 27 release. Prices still increased 0.1% monthly. Petroleum, chemicals, rubber and plastics contributed 1.7 percentage points to annual inflation, food and related products 1.1 points, and metals and machinery 0.8 points. Transport-equipment prices fell 4.5% monthly, offsetting increases elsewhere. Intermediate-goods prices rose 0.4% annually and 0.6% monthly, while electricity and water prices increased 12.1% annually. The report therefore showed different price movements across finished products, industrial intermediates and utilities rather than a single uniform change in manufacturing costs.
The August 29 release put July’s final-manufacturing inflation at 4.2%, down from June’s 4.6%, and recorded a 0.2% monthly price decline. Petroleum and chemical-related products contributed 1.2 percentage points to annual inflation, food and related products one point, and metals and machinery 0.7 points. Excluding petroleum, final-goods prices rose 3.7% annually and 0.1% monthly. Intermediate-goods inflation was also 4.2%, with a 0.2% monthly fall. Electricity and water differed sharply, rising 10.2% annually and 9.6% monthly. Easing final-goods inflation therefore accompanied continued annual increases in other price series, including industrial intermediates and utilities.
From restrictive rates to September’s cut
The South African Reserve Bank’s decisions provide the monetary-policy setting for manufacturers’ demand expectations. On January 25, the Monetary Policy Committee unanimously kept the policy rate at 8.25%. The bank forecast economic growth of 1.2% in 2024 and 1.3% in 2025, identifying electricity and logistics as constraints. Inflation had averaged 6.0% in 2023; the January forecast put the 2024 average at 5.0%. Its exchange-rate starting assumption was R18.65 per dollar. These figures were the bank’s forecasts and assumptions at the beginning of the year, accompanying an actual decision to leave the rate unchanged.
On March 27, the committee again unanimously held the rate at 8.25%. February’s headline consumer inflation was 5.6%, with core inflation at 5.0%. The bank retained its 1.2% growth forecast for 2024 and identified electricity, ports and rail as binding constraints. It estimated that electricity shortages had reduced 2023 growth by 1.5 percentage points and projected a smaller 0.6-point drag in 2024. Inflation was expected to reach the target midpoint only toward the end of 2025. That delayed forecast and the unchanged rate described the March policy assessment, before the later improvement in electricity supply.
The May 30 decision also left the rate at 8.25%, unanimously. The bank noted that load-shedding had not occurred since March 26, while maintaining its 1.2% growth forecast for the year. High-frequency indicators still suggested a weak first quarter. Its inflation projection now reached the target midpoint in the second quarter of 2025, earlier than the end-2025 timing in March. The exchange-rate starting assumption was R18.57 per dollar. The statement thus incorporated improved electricity conditions and an earlier projected inflation milestone, while the committee’s decision continued to keep borrowing conditions unchanged at the policy-rate level.
By July 18, the vote had divided, but the rate remained at 8.25%. Four committee members preferred holding it; two favoured a quarter-point reduction. Headline inflation in May had been 5.2%, and the bank lowered its forecast for average 2024 inflation to 4.9% from 5.1%. It estimated second-quarter growth at 0.6%, an assessment preceding the official GDP release. The decision therefore showed differing views on the timing of easing, alongside a lower inflation forecast. Neither the two members’ preference nor the growth estimate constituted an implemented rate cut or a final statistical result for the quarter.
- On September 19, the committee cut the policy rate by 25 basis points to 8%, effective September 20.
- August’s headline inflation had fallen to 4.4%, just below the 4.5% midpoint of the 3–6% target range.
The bank expected growth of 0.6% in each of the third and fourth quarters, while noting four consecutive quarters of declining investment. Its projected future rate path remained a model forecast, rather than a commitment to subsequent decisions.






Leave a comment